Products
Agent
Design
Database
Deployments
Security
Integrations
Mobile
For Work
Teams
Replit for teams to build together
Enterprise
Replit with Enterprise-grade security & controls
Use Cases
Business Apps
Rapid Prototyping
Role
PM
Designers
Operations
Software Developers
Small business
SMB Owners
Founders
Resources
Get Started
Docs
Community
Experts Network
Inspiration
Customer Stories
Gallery
Blog
News
Pricing
Careers
Agent
Contact sales
Log in
Sign up
AI Website and App Builders
Filter by category
Website
App
Clear Filter
Thank you! Your submission has been received!
Oops! Something went wrong while submitting the form.
All results
100
builds
Wedding Website Builder
Website
Learn more
Landing Page Builder
Website
Learn more
Website Form Builder
Website
Learn more
Web App Builder
App
Learn more
Real Estate Website Builder
Website
Learn more
Membership Website Builder
Website
Learn more
Android App Builder
App
Learn more
AI Ecommerce Website Builder
Website
Learn more
Booking Website Builder
Website
Learn more
Church Website Builder
Website
Learn more
Portfolio Website Builder
Website
Learn more
Blog Website Builder
Website
Learn more
Vacation Rental Website Builder
Website
Learn more
Interactive Website Builder
Website
Learn more
Restaurant Website Builder
Website
Learn more
B2B Website Builder
Website
Learn more
Fitness Website Builder
Website
Learn more
Hotel Website Builder
Website
Learn more
iPhone App Builder
App
Learn more
Car Dealer Website Builder
Website
Learn more
Roofing Website Builder
Website
Learn more
Mobile Website Builder
Website
Learn more
CMS Website Builder
Website
Learn more
Law Firm Website Builder
Website
Learn more
Database Website Builder
Website
Learn more
Dropshipping Website Builder
Website
Learn more
Ai Web App Builder
App
Learn more
Plumber Website Builder
Website
Learn more
Progressive Web App Builder
App
Learn more
Sports Website Builder
Website
Learn more
Python Website Builder
Website
Learn more
Fintech App Builder
App
Learn more
Photography Website Builder
Website
Learn more
Artist Website Builder
Website
Learn more
Lead Generation Website Builder
Website
Learn more
Forum Website Builder
Website
Learn more
Veterinary Website Builder
Website
Learn more
Video Website Builder
Website
Learn more
Education App Builder
App
Learn more
Grocery App Builder
App
Learn more
App Prototype Builder
App
Learn more
Restaurant Mobile App Builder
App
Learn more
Clothing Website Builder
Website
Learn more
Dating App Builder
App
Learn more
Chat App Builder
App
Learn more
Medical Website Builder
Website
Learn more
Travel Website Builder
Website
Learn more
News Website Builder
Website
Learn more
Music Website Builder
Website
Learn more
Directory Website Builder
Website
Learn more
Handyman Website Builder
Website
Learn more
Real Estate App Builder
App
Learn more
Food Delivery App Builder
App
Learn more
Shopify Expert Website Builder
Website
Learn more
Classified Ads Website Builder
Website
Learn more
Bakery Website Builder
Website
Learn more
Multilingual Website Builder
Website
Learn more
Multi Vendor Marketplace App Builder
App
Learn more
Fitness App Builder
App
Learn more
Financial Website Builder
Website
Learn more
Electrician Website Builder
Website
Learn more
Web3 Website Builder
Website
Learn more
Hvac Website Builder
Website
Learn more
Affiliate Website Builder
Website
Learn more
LMS Website Builder
Website
Learn more
Crm With Website Builder
Website
Learn more
Social Media App Builder
App
Learn more
Construction Website Builder
Website
Learn more
Game Website Builder
Website
Learn more
Dog Breeder Website Builder
Website
Learn more
Blockchain App Builder
App
Learn more
Builder Project Management App
App
Learn more
Florist Website Builder
Website
Learn more
Saas Landing Page Builder
Website
Learn more
Plumbing Website Builder
Website
Learn more
Dental Website Builder
Website
Learn more
Headless CMS Page Builder
Website
Learn more
Property Management Website Builder
Website
Learn more
Credit Repair Website Builder
Website
Learn more
React Web App Builder
App
Learn more
Car Rental Website Builder
Website
Learn more
Therapy Website Builder
Website
Learn more
MLM Website Builder
Website
Learn more
Mortgage Website Builder
Website
Learn more
Agency Website Builder
Website
Learn more
Insurance Website Builder
Website
Learn more
Forex Website Builder
Website
Learn more
Automotive Website Builder
Website
Learn more
Job Board Website Builder
Website
Learn more
Home Inspector Website Builder
Website
Learn more
Website Builder For Tradesmen
Website
Learn more
CPA Website Builder
Website
Learn more
Betting Website Builder
Website
Learn more
Catering Website Builder
Website
Learn more
White Label App Builder
App
Learn more
Website Calculator Builder
Website
Learn more
Cleaning Business Website Builder
Website
Learn more
Website Builder For Trucking Company
Website
Learn more
Recruitment Website Builder
Website
Learn more
Financial Advisor Website Builder
Website
Learn more
Apartment Website Builder
Website
Learn more
Franchise Website Builder
Website
Learn more
Delivery App Builder
App
Learn more
Salon Website Builder
Website
Learn more
Direct Booking Website Builder
Website
Learn more
Online Course Website Builder
Website
Learn more
Architect Website Builder
Website
Learn more
Catalog App Builder
App
Learn more
Landscaping Website Builder
Website
Learn more
IoT App Builder
App
Learn more
Cross-Platform App Builder
App
Learn more
Church App Builder
App
Learn more
Catholic Website Builder
Website
Learn more
Gun-Friendly Website Builder
Website
Learn more
Competition Website Builder
Website
Learn more
Martial Arts Website Builder
Website
Learn more
Marketplace Website Builder
Website
Learn more
Database App Builder
App
Learn more
Bed And Breakfast Website Builder
Website
Learn more
Free Loyalty App Builder
App
Learn more
Restaurant App Builder
App
Learn more
Taxi Booking App Builder
App
Learn more
Online Grocery Store Website Builder
Website
Learn more
Event Website Builder
Website
Learn more
Nonprofit Website Builder
Website
Learn more
Hoa Website Builder
Website
Learn more
Auto Parts Website Builder
Website
Learn more
News App Builder
App
Learn more
PHP App Builder
App
Learn more
Directory App Builder
App
Learn more
Hire App Builder
App
Learn more
Pharmacy Website Builder
Website
Learn more
Jewelry Website Builder
Website
Learn more
Conference Website Builder
Website
Learn more
Auction Website Builder
Website
Learn more
Event App Builder
App
Learn more
Composer Website Builder
Website
Learn more
AI Ecommerce Website Builder
Website
Learn more
AI Html Website Builder
Website
Learn more
AI Wordpress Website Builder
Website
Learn more
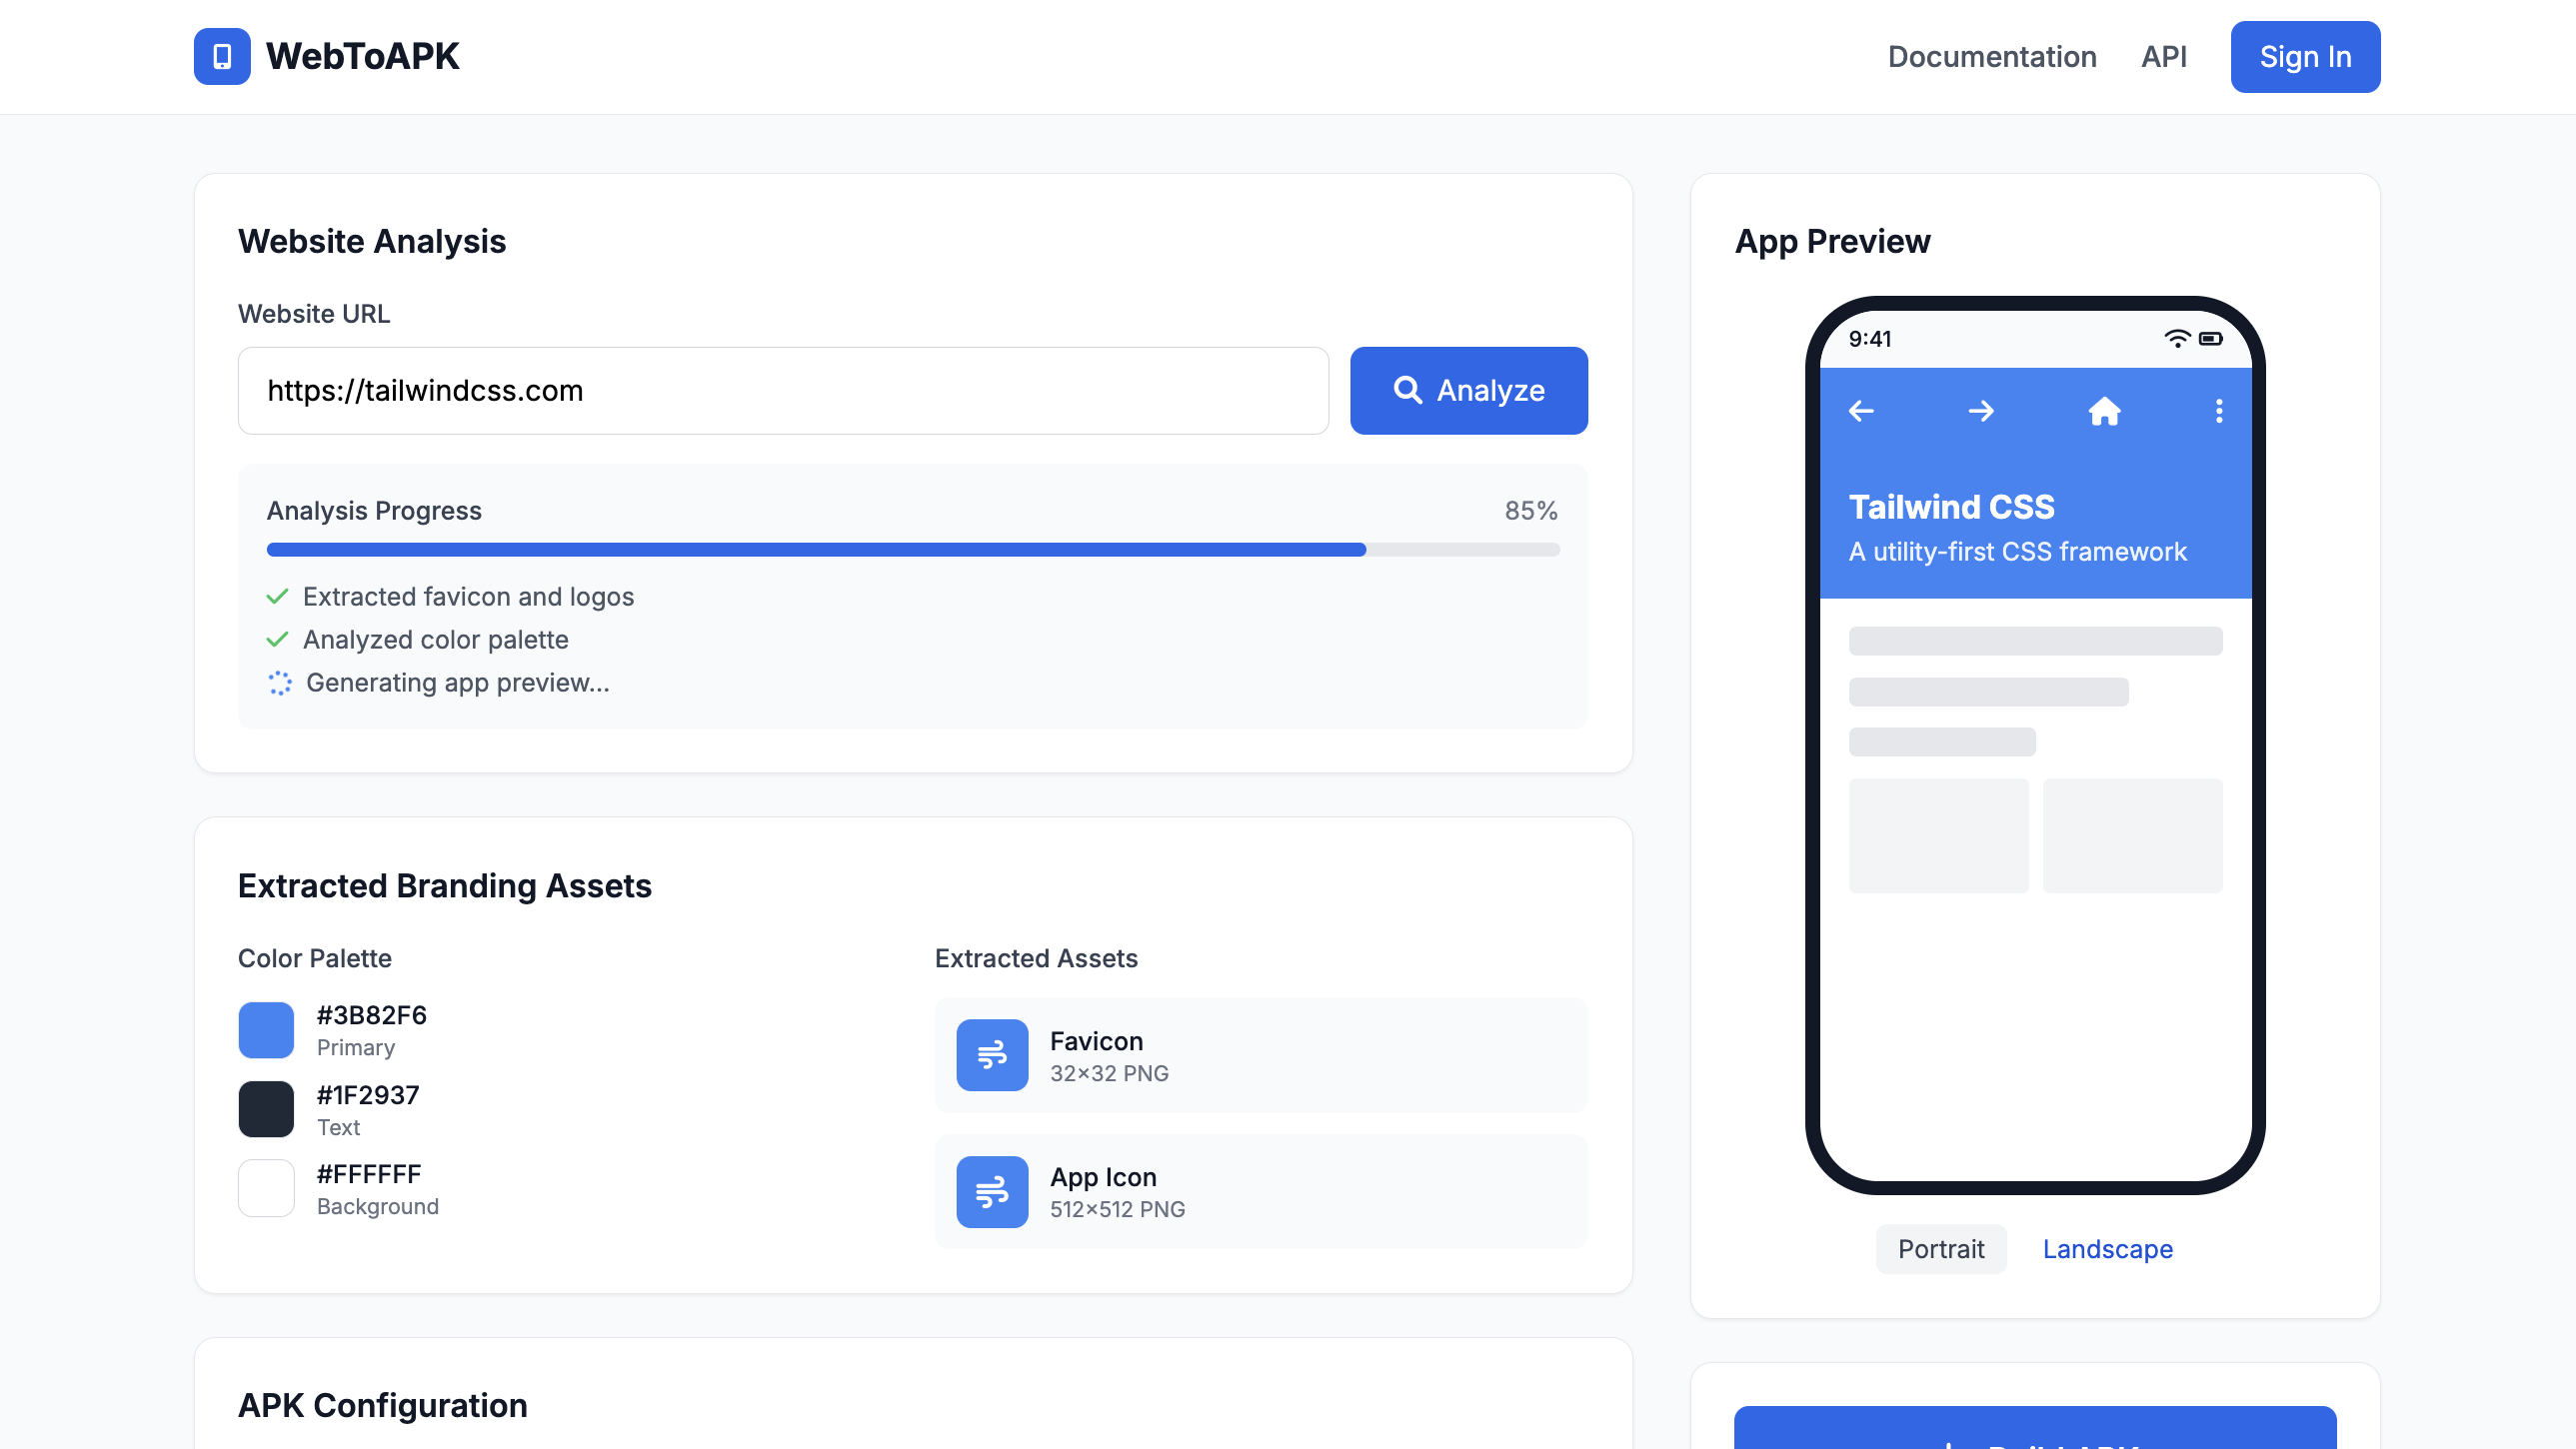
Website To Apk Builder
Website
Learn more
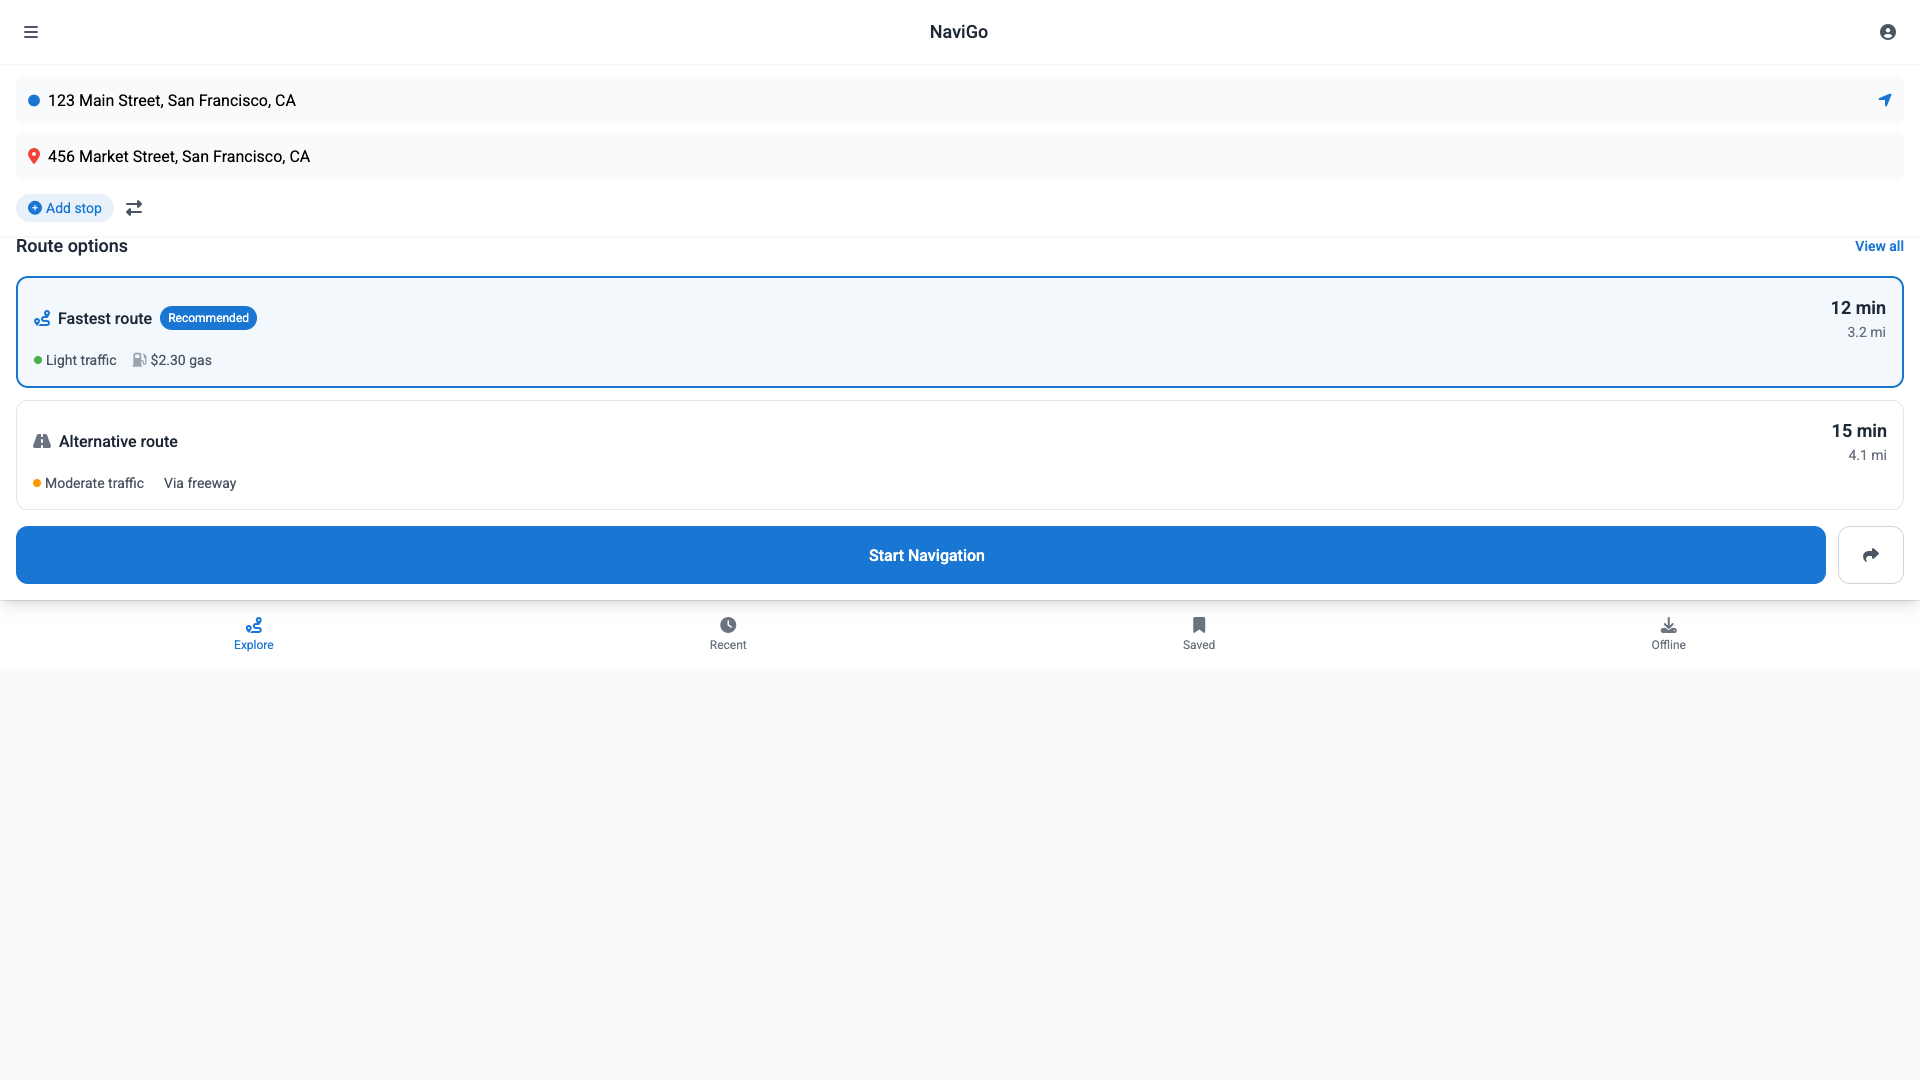
Map App Builder
App
Learn more
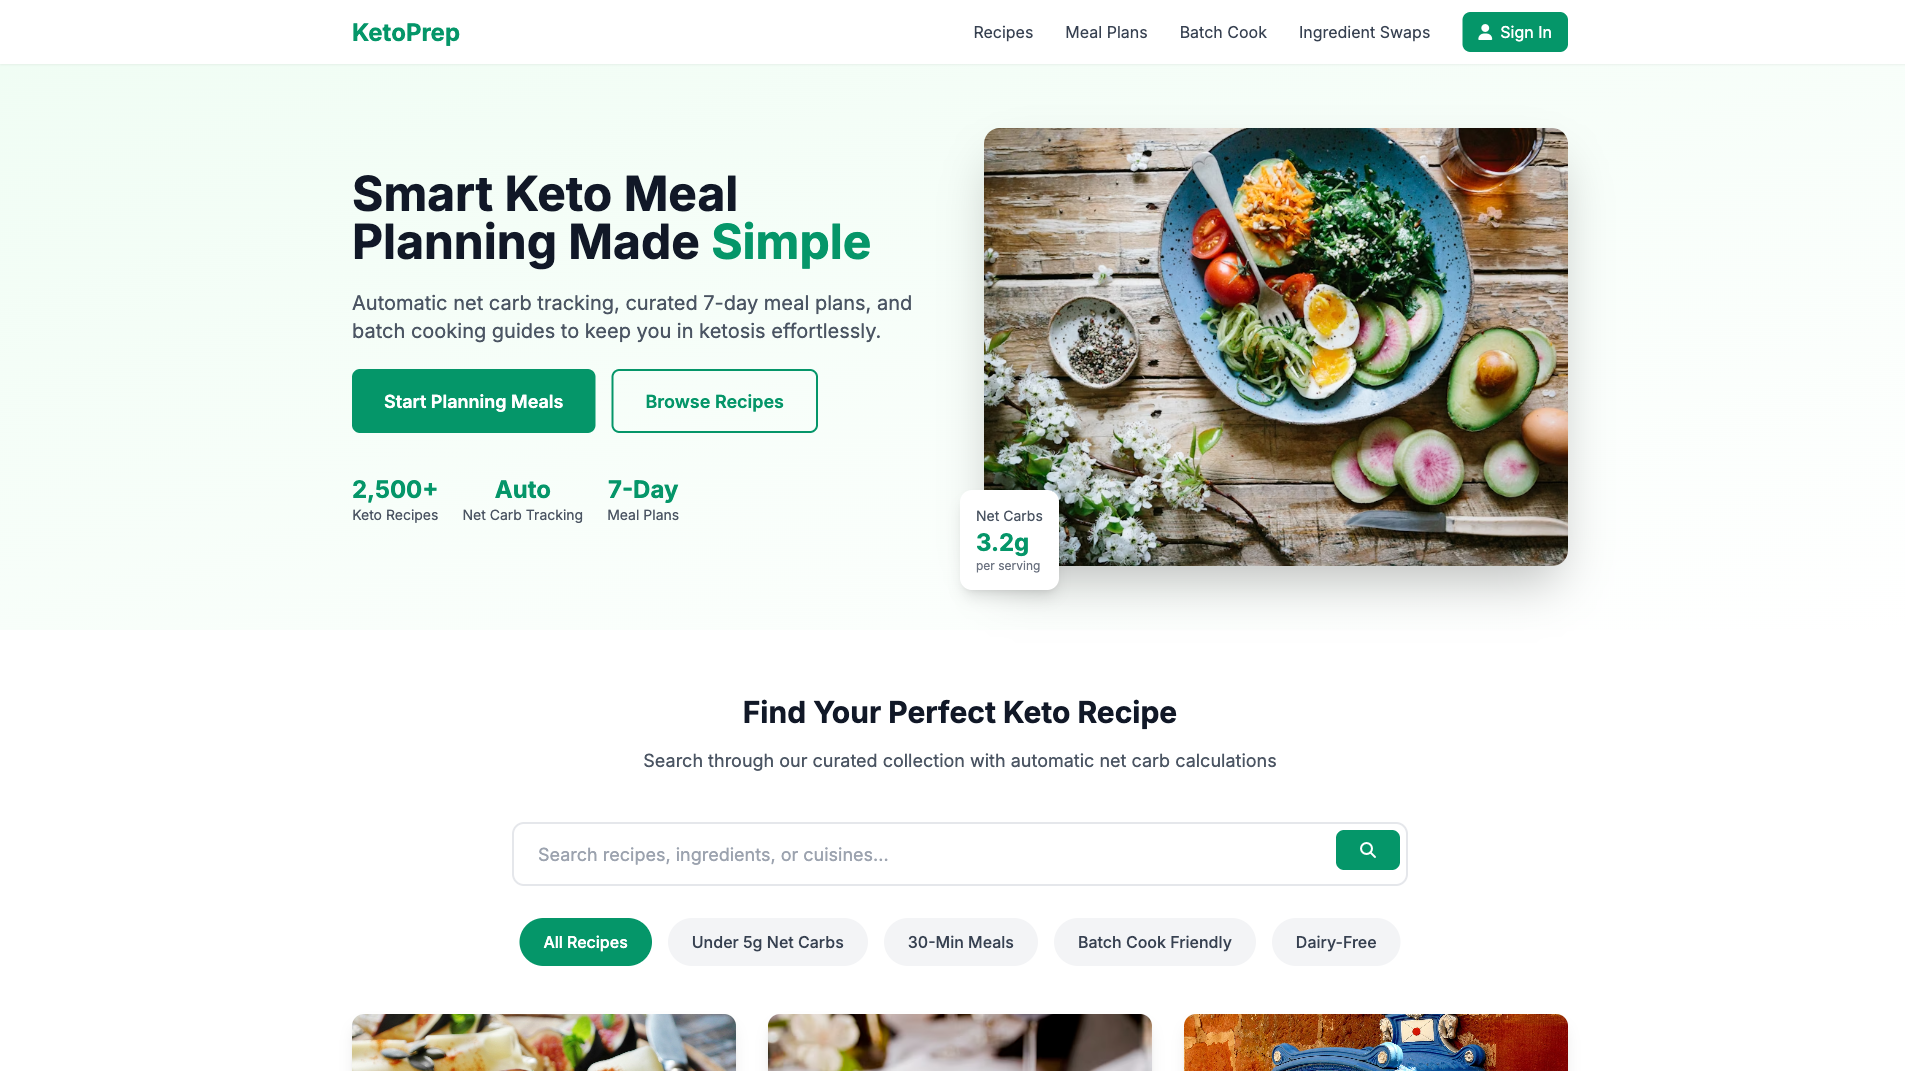
Meal Prep Website Builder
Website
Learn more
3D Website Builder
Website
Learn more
Responsive Website Builder
Website
Learn more
UX Portfolio Website Builder
Website
Learn more
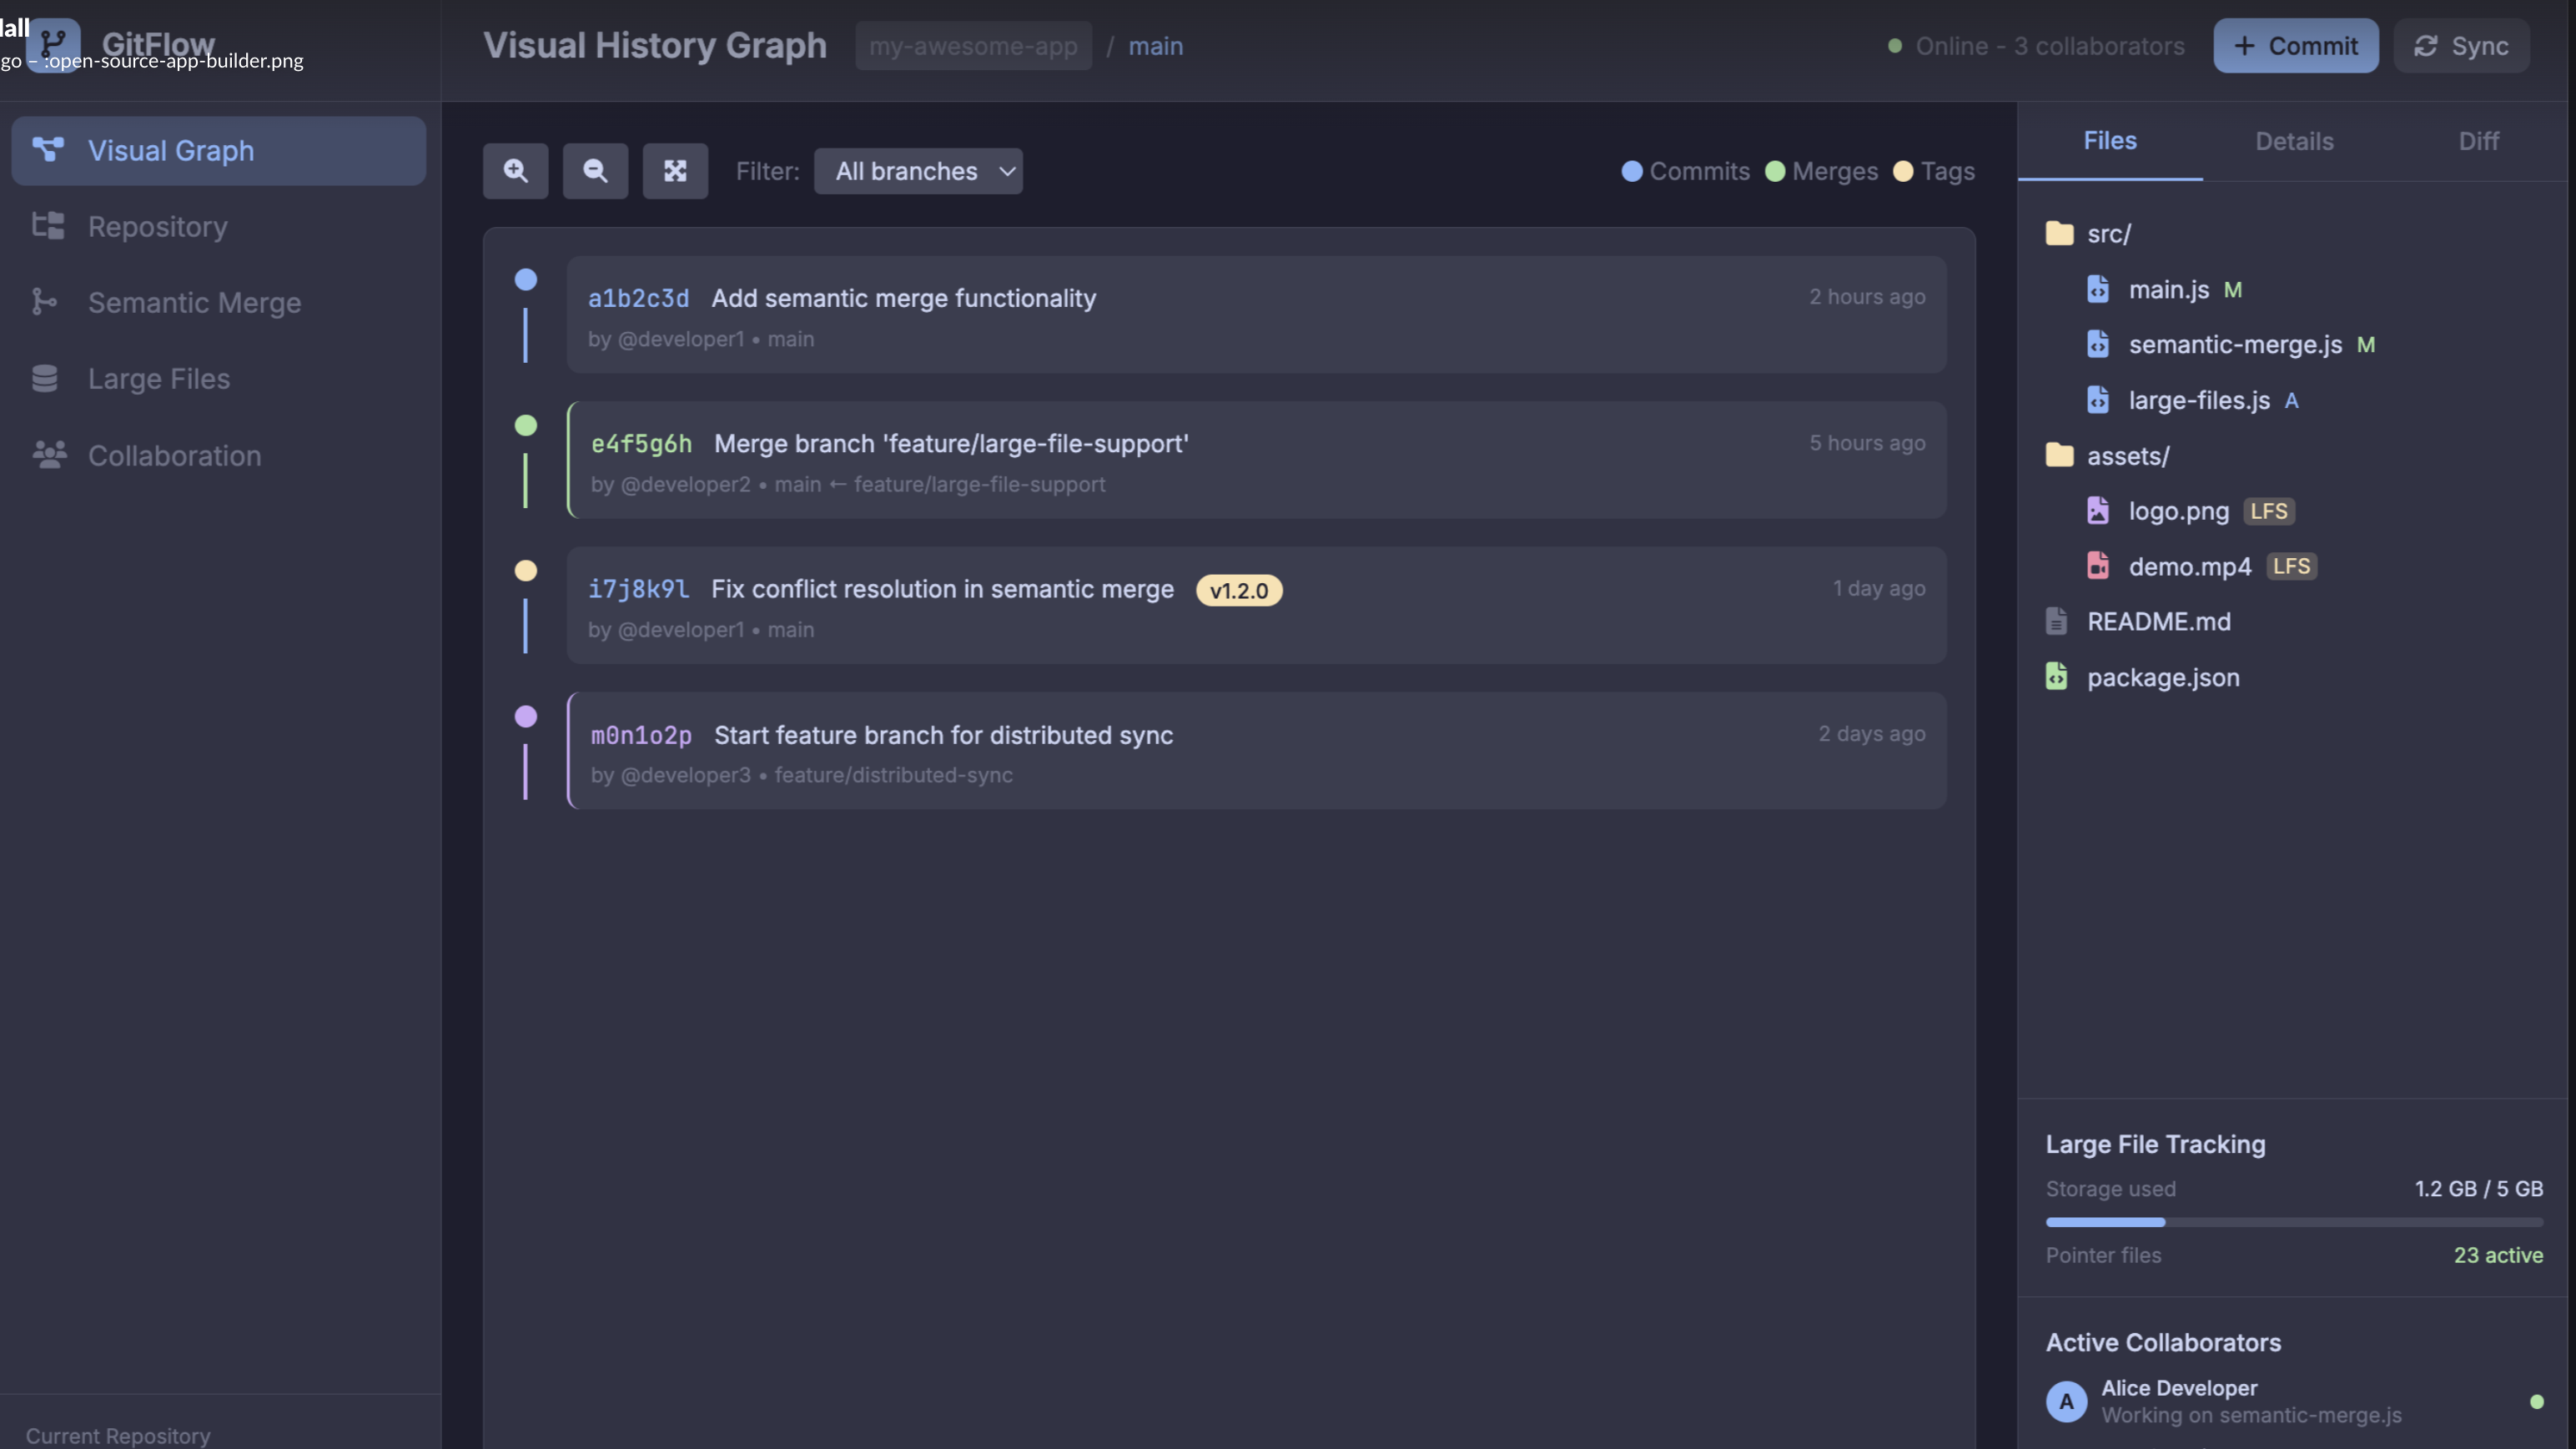
Open Source App Builder
App
Learn more
Charity Website Builder
Website
Learn more
Flash Website Builder
Website
Learn more
Wiki Website Builder
Website
Learn more
DJ Website Builder
Website
Learn more
Niche Website Builder
Website
Learn more
City Website Builder
Website
Learn more
Kids Website Builder
Website
Learn more
Funnel Website Builder
Website
Learn more
Wysiwyg Website Builder
Website
Learn more
Ebook Website Builder
Website
Learn more
Podcast Website Builder
Website
Learn more
Wysiwyg App Builder
App
Learn more
VR App Builder
App
Learn more
Radio App Builder
App
Learn more
AR App Builder
App
Learn more
Author Website Builder
Website
Learn more
Festival App Builder
App
Learn more
Political Campaign Website Builder
Website
Learn more
Birthday Website Builder
Website
Learn more
Yoga Website Builder
Website
Learn more
Political Website Builder
Website
Learn more
Bounce House Website Builder
Website
Learn more
Life Coach Website Builder
Website
Learn more
Dynamic Website Builder
Website
Learn more
No items found.
Vibe code the websites and apps of your dreams
Build now