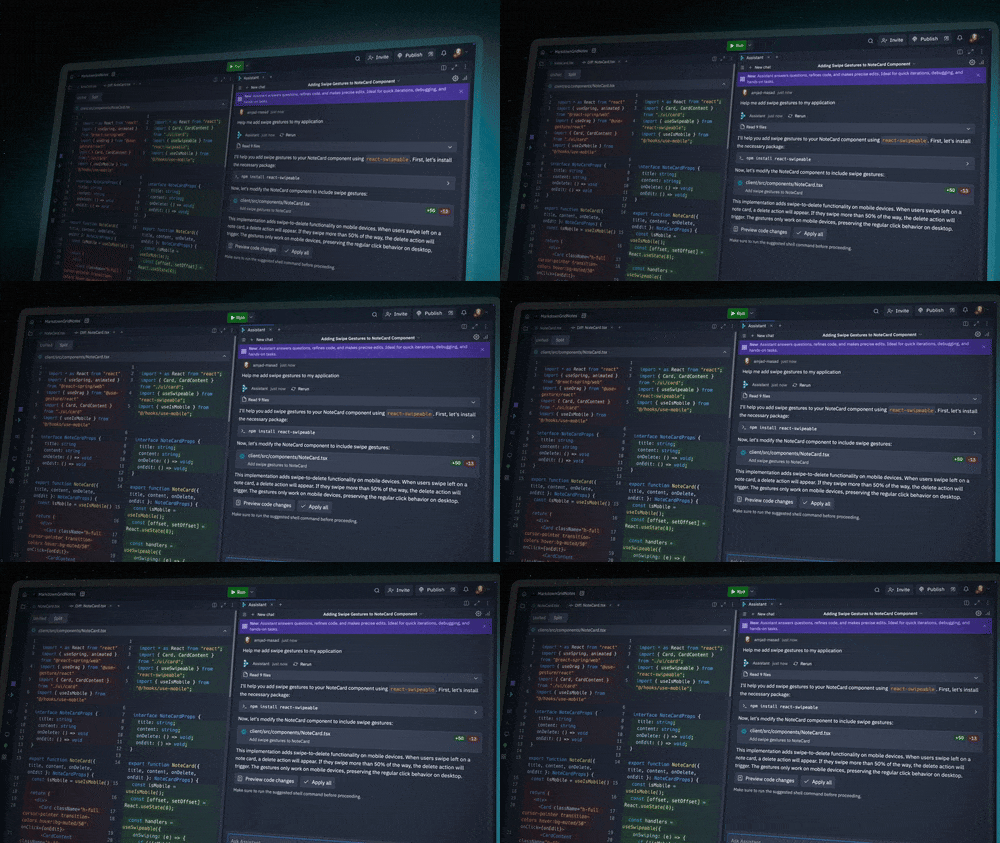
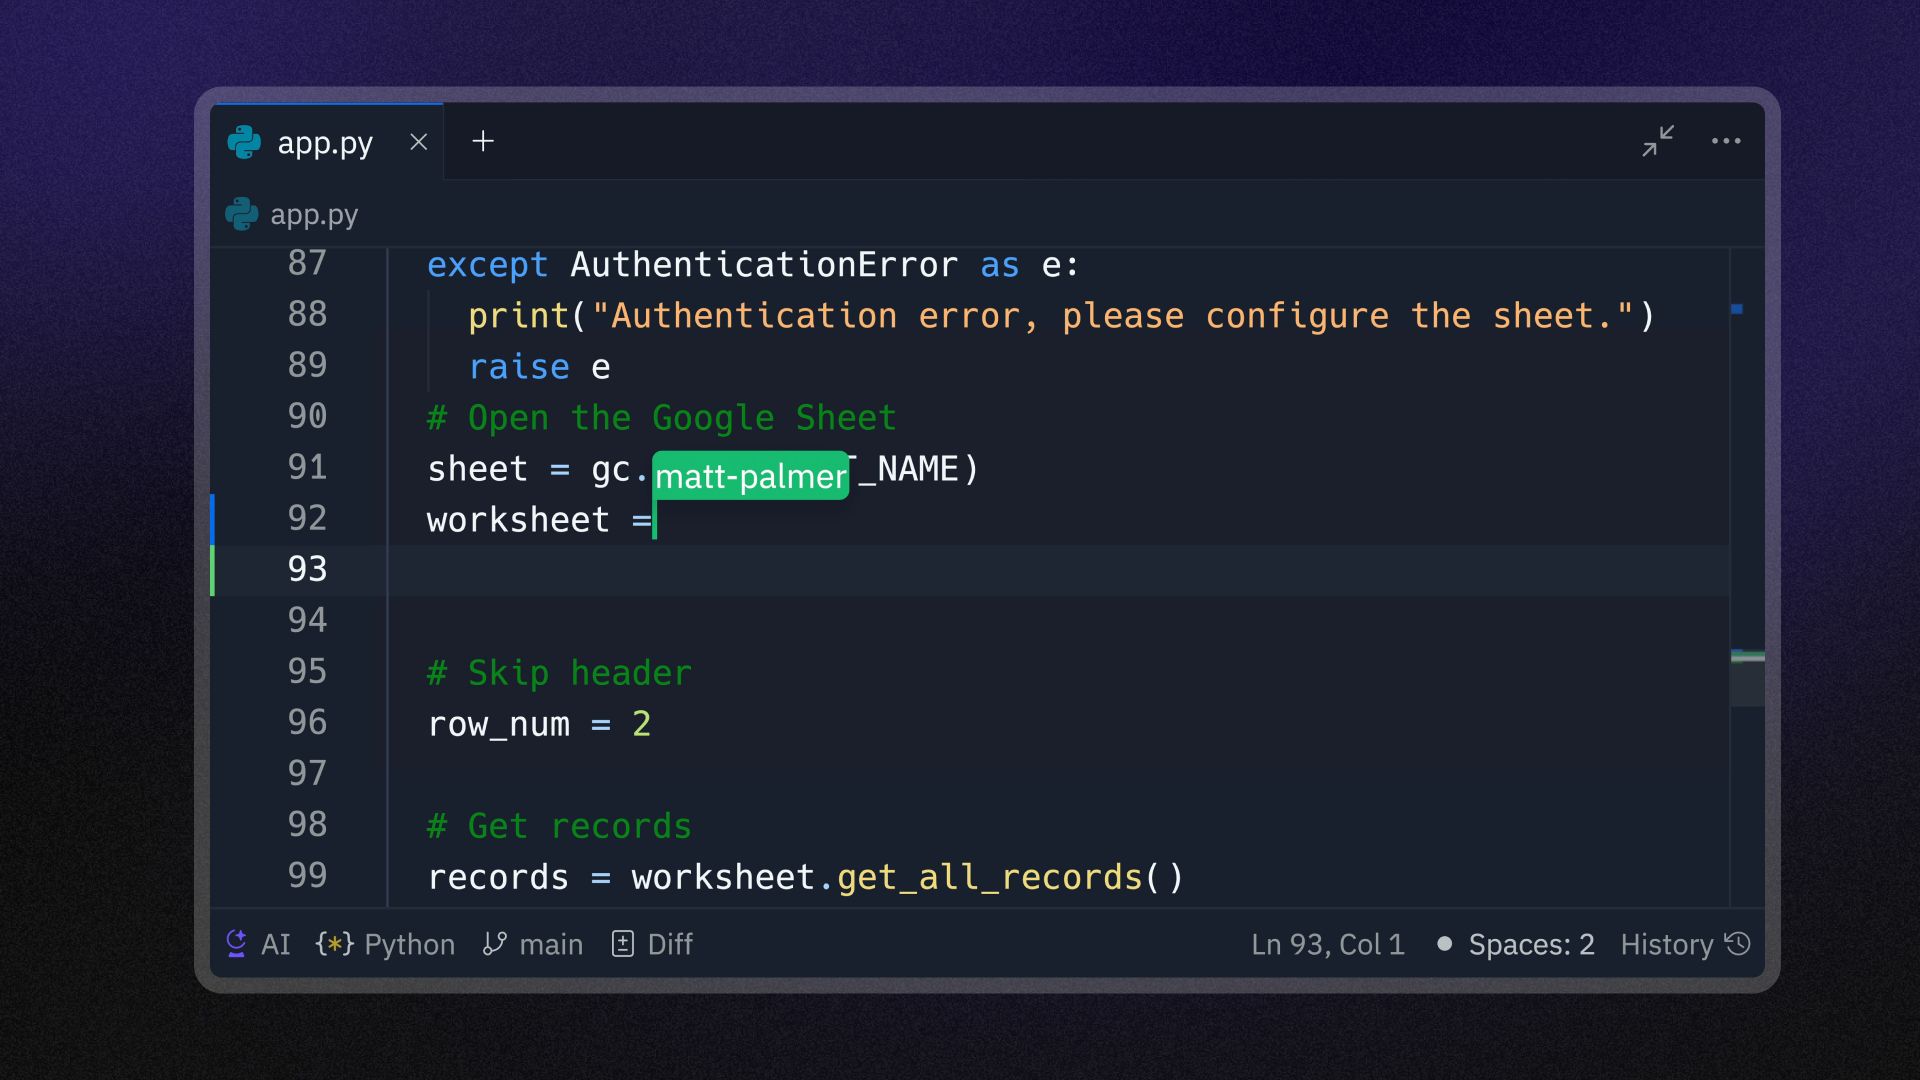
Build dashboards & visualize data with AI
Replit empowers anyone to create interactive dashboards without complex coding, using AI to transform raw data into customizable visualizations directly in your browser.
Transform data into powerful visualizations using natural language
Create everything from real-time analytics and system monitoring dashboards to comprehensive business intelligence tools and KPI trackers—all through simple, conversational prompts.
Reimagining data visualization with AI

Data integration made simple
Connect to CSV files, databases, APIs, and cloud storage platforms with natural language requests, eliminating the need for complex configuration or authentication code.

Dynamic visualizations without the learning curve
Replit Agent generates charts, graphs, heatmaps, and interactive elements based on your plain-English descriptions, without requiring knowledge of visualization libraries.

Real-time collaboration
Work simultaneously with teammates on different dashboard components, seeing each other's changes instantly while avoiding version conflicts.

Responsive design built-in
Every dashboard automatically adapts to different screen sizes, ensuring your visualizations look perfect on desktops, tablets, and mobile devices.

Update from anywhere
Monitor and modify your dashboards from any location using Replit's mobile app, making real-time adjustments whenever insights are needed.
How to build dashboards with Replit
Describe your dashboard vision
Explain to Replit Agent what metrics you want to track, which data sources to use, and how you want information displayed using everyday language.
Replit Agent sets up your environment
Watch as Agent automatically installs and configures visualization libraries like Chart.js, D3.js, or Plotly, and sets up database connections required for your project.
Customize to unlock the insights you need
Refine your visualizations by simply asking Agent to "add filters," "highlight trends," or "make this interactive" without writing complex code.
Deploy and share with stakeholders
Launch your dashboard with a single click and share access with team members, clients, or stakeholders through customizable permission settings.
Generate the dashboard you need today
Start transforming your data into actionable insights now — Replit's AI-powered platform lets you build and deploy sophisticated dashboards in minutes, not weeks.
