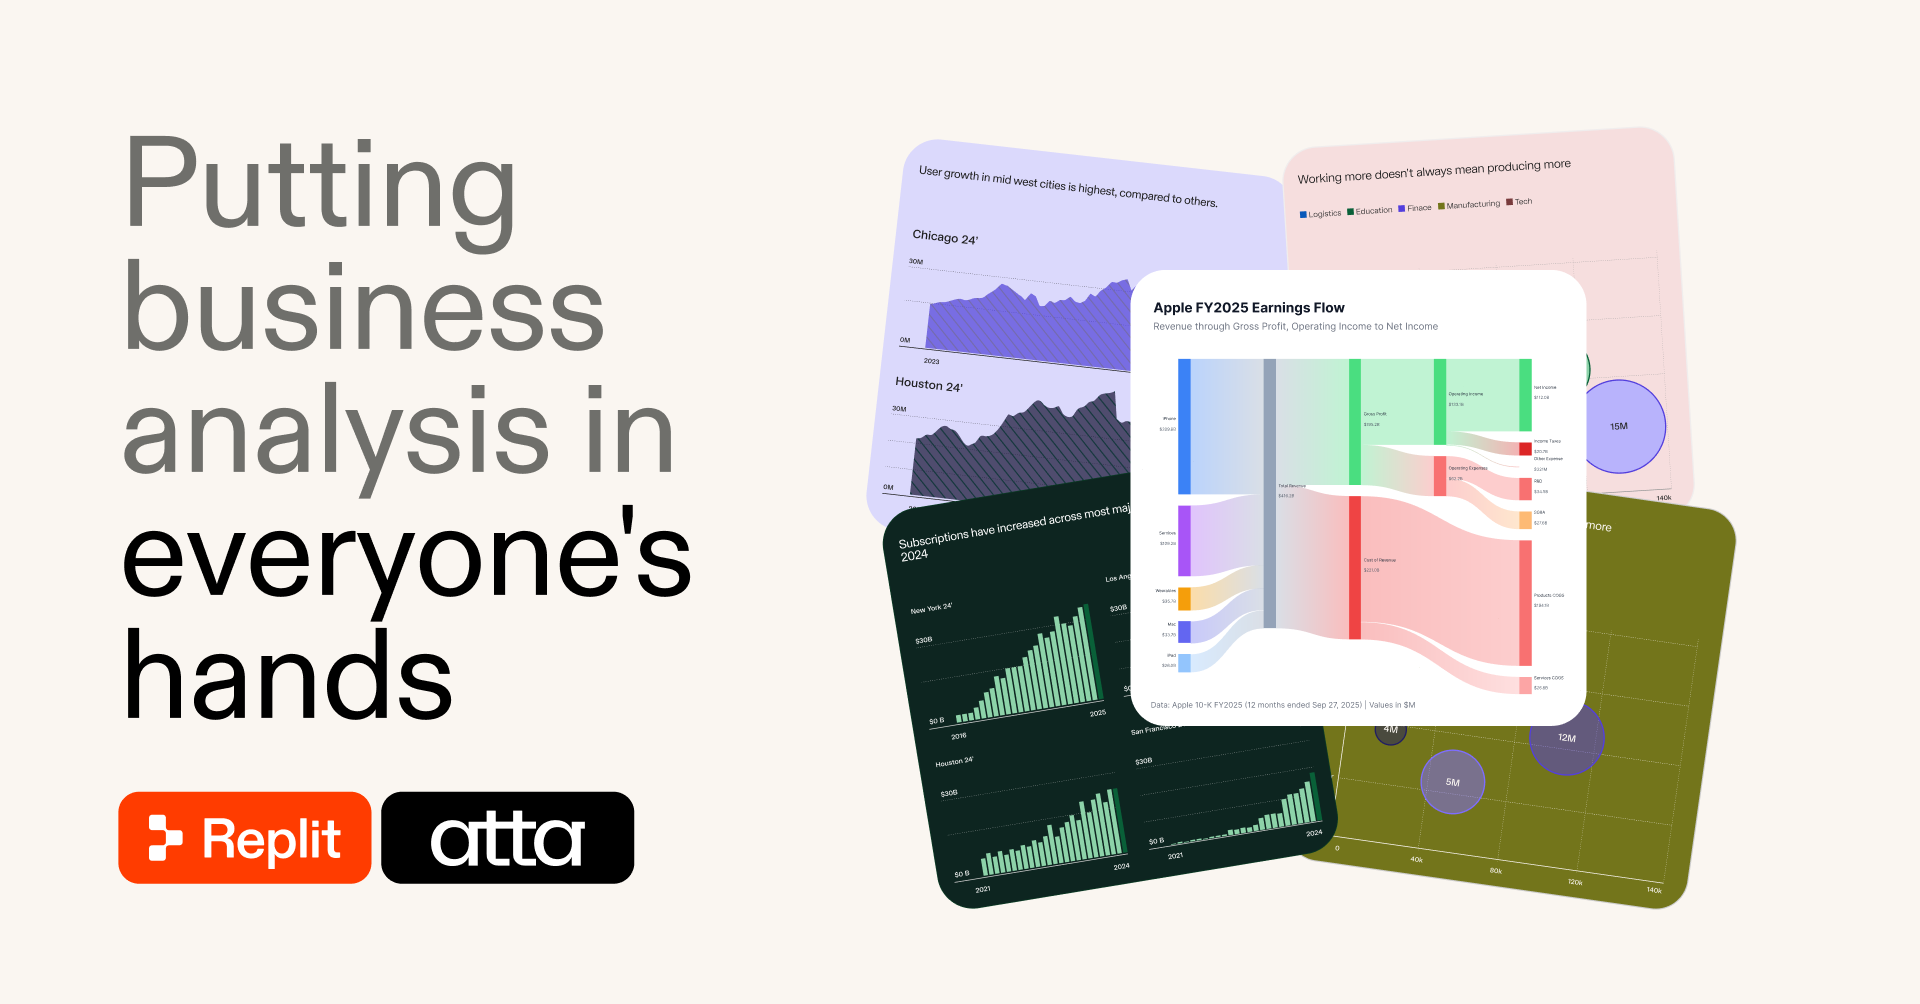

Today, we’re announcing that Replit has acquired San Francisco-based Atta, bringing its approach to business analysis and high-quality, purpose-built charting into Replit.
Our mission is to make useful intelligence accessible to everyone. For businesses, that means giving the people closest to a problem the ability to investigate it, explain what they find, and act on their expertise.
Product leaders understand their customers. Marketing teams understand their channels. Sales and Revenue Operations teams understand their pipeline. But answering questions with data often requires translating that knowledge into an analysis request, waiting for the results, and repeating the process for every follow-up question.
We believe business intelligence should work differently. Anyone should be able to begin with a question, explore the answer, and put what they learn to work without needing a separate set of technical tools.
Atta shares that belief. Together, we’re building toward a future in which analysis is part of the work itself, not a separate destination.
The first capability is available today: interactive charts directly in Replit chat.
Get beyond the headline number
Why is this quarter’s sales pipeline falling short? Which marketing channels are performing best? What’s behind a drop in product retention?
Replit helps you investigate where performance changed, which segments drove the change, and what deserves a closer look. It handles the queries and analytical steps so you can focus on interpreting the results and deciding what to do next, without writing SQL.
Just ask Replit Agent “let’s visualize this” or ask for a specific chart, and you’ll get great data visualization right in your chat.
Make every finding clear
Good analysis deserves a clear, beautiful presentation. Replit selects a visualization suited to your data and question, with thoughtful color, readable labels, and polished layouts that make complex findings easier to understand.
A waterfall chart can explain a change in revenue. A heatmap can reveal patterns in retention. Whatever the question, the goal is the same: help your team see what matters and communicate it with confidence.
Built for high stakes moments
Whether you’re preparing for a leadership review or sharing findings across teams, you shouldn’t have to clean up after AI.
Atta’s purpose-built charting system produces consistent, interactive, on-brand visualizations that are ready to share. Labels, spacing, and layouts adapt as charts are resized, so you can spend less time fixing the presentation and more time discussing what the data means.
From data analysis to strategic work
Our longer-term vision is of self-driving companies, where employees feel promoted and capable from end-to-end. Data analysis should be woven into that work, not confined to a separate tool or specialist workflow.
In Replit, an investigation could become a recurring routine. Its findings could become slides for a leadership review. Those insights could then shape the next product, campaign, or internal tool a team builds.
Bringing Atta and its founders, Omar Shaik and Amine Ben Khalifa, into Replit connects their analytical expertise and charting technology with this broader environment.
Inline charts are the starting point. Our ambition is to help everyone ask better questions, develop a deeper understanding of their business, and turn insight into action.
Try in-line charts today
Open a Replit conversation, upload a dataset or connect a data source, and ask a question. Replit will analyze the data and present the results with Atta’s high-quality charts.
Bring your data and the question you want to answer.